- Help Center
- Store administration
- Discover the back office
- Discover the dashboard
Discover the dashboard
Anne-Sophie F
-Updated on Friday, August 18, 2023
The dashboard is essential for tracking major sales trends, learning more about your customers' expectations and knowing whether your store is heading in the right direction.
To access: Dashboard
The dashboard is divided into several blocks to give you an overview of your store's activity.
How do you choose a period to analyze?
To compare trends and their evolution over time, it can be interesting to study your data over a period of time. At the top of the dashboard, a bar lets you choose the temporality of your statistics. It is presented as follows:
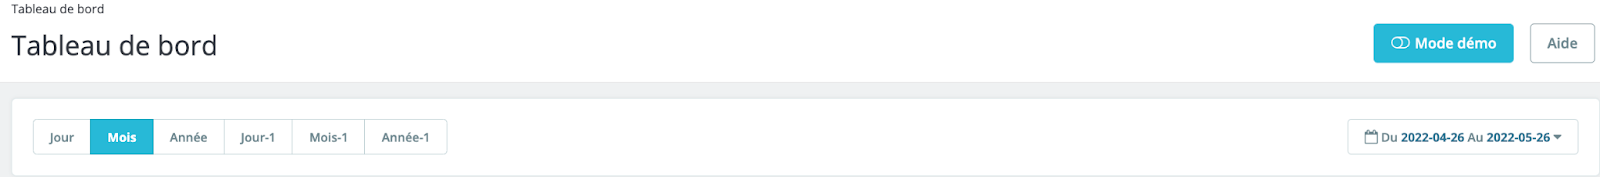
Thanks to this bar, you can :
- explore statistics for the day, month or year
- explore statistics for the previous day, month or year
- select a specific date using the button on the right, which allows you to enter a period of time between two dates
You can also compare two time periods by checking the "Compare with" box that opens when you click on the date selector.
Once you have selected your period, all content blocks on the dashboard are automatically updated.
How do I explore the dashboard?
The dashboard looks like this:
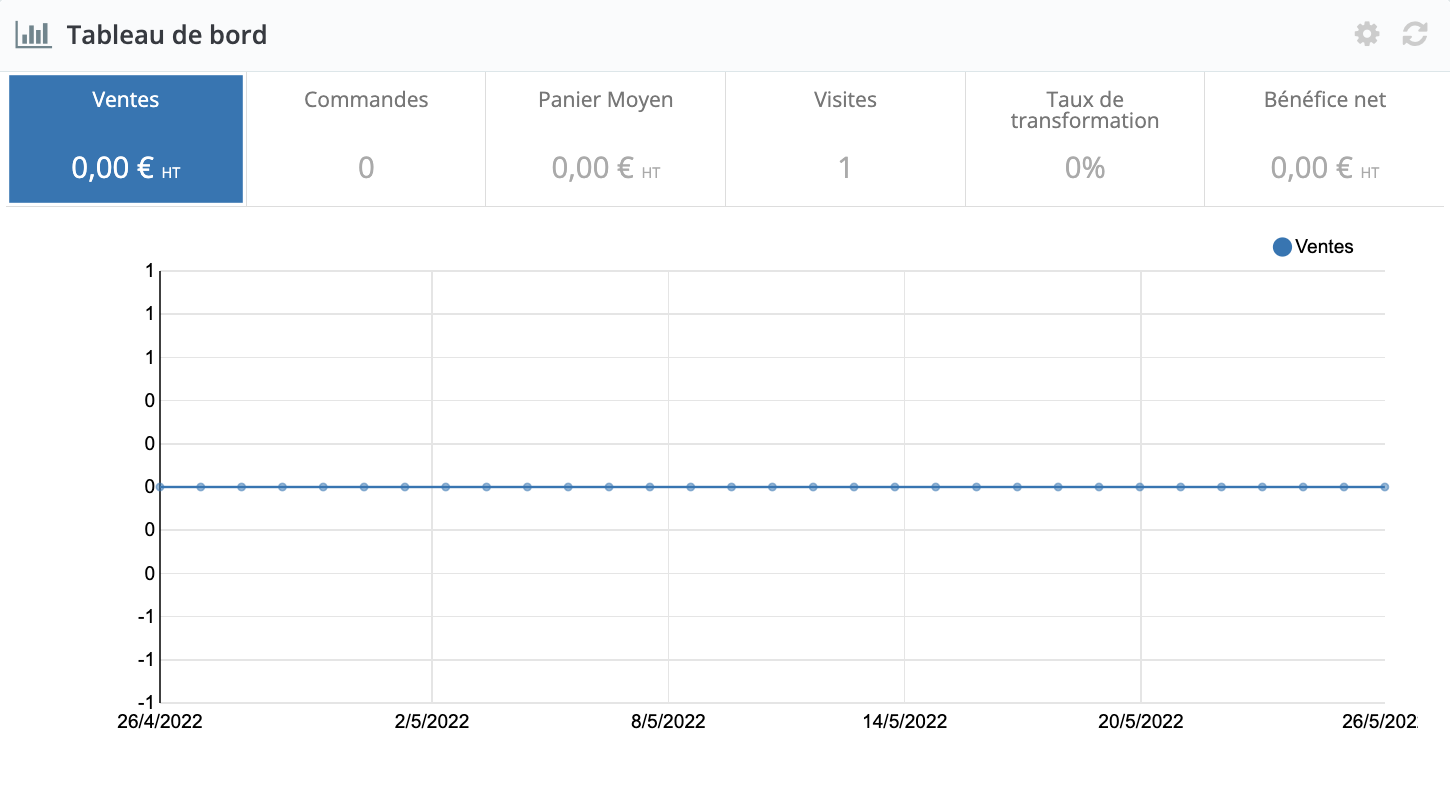
This table is the dashboard's main information block. Featuring a variety of graphics, it really helps you see whether the direction your store is taking is the right one or not. Click on one of the sections to display :
- Sales
- The number of orders
- Average basket per customer, HT
- The number of visits to your store
- Your transformation rate
- Your profit net, HT
Clicking on the configuration icon, represented by a cogwheel in the top right-hand corner, opens a new page. To best indicate your trends, you can configure the following parameters:
- Average bank commission per means of payment
- Average delivery costs per shipping method
- Average brand rate
- Other charges for each order
How do I explore the "Forecasts" block?
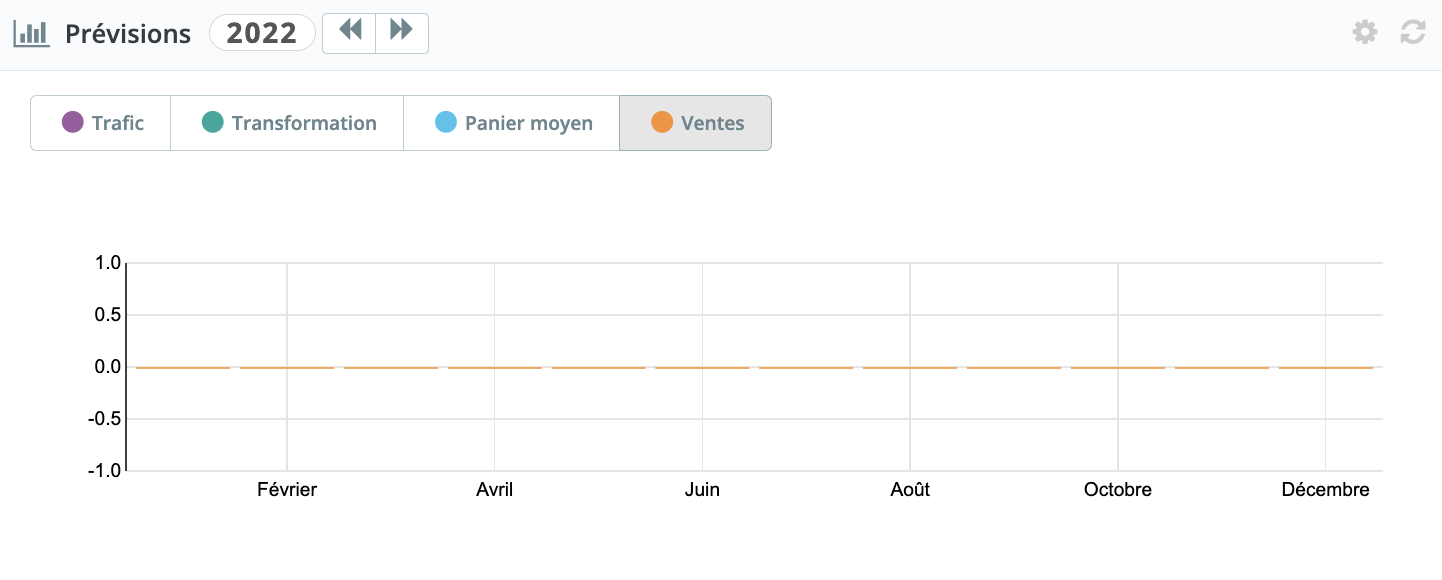
The "Forecasts" block shows you the targets you've set yourself for the coming months, and how these match up with your sales. You can hover your mouse over the graph to see the details. This block is presented as follows:
How do I configure the "Forecast" block?
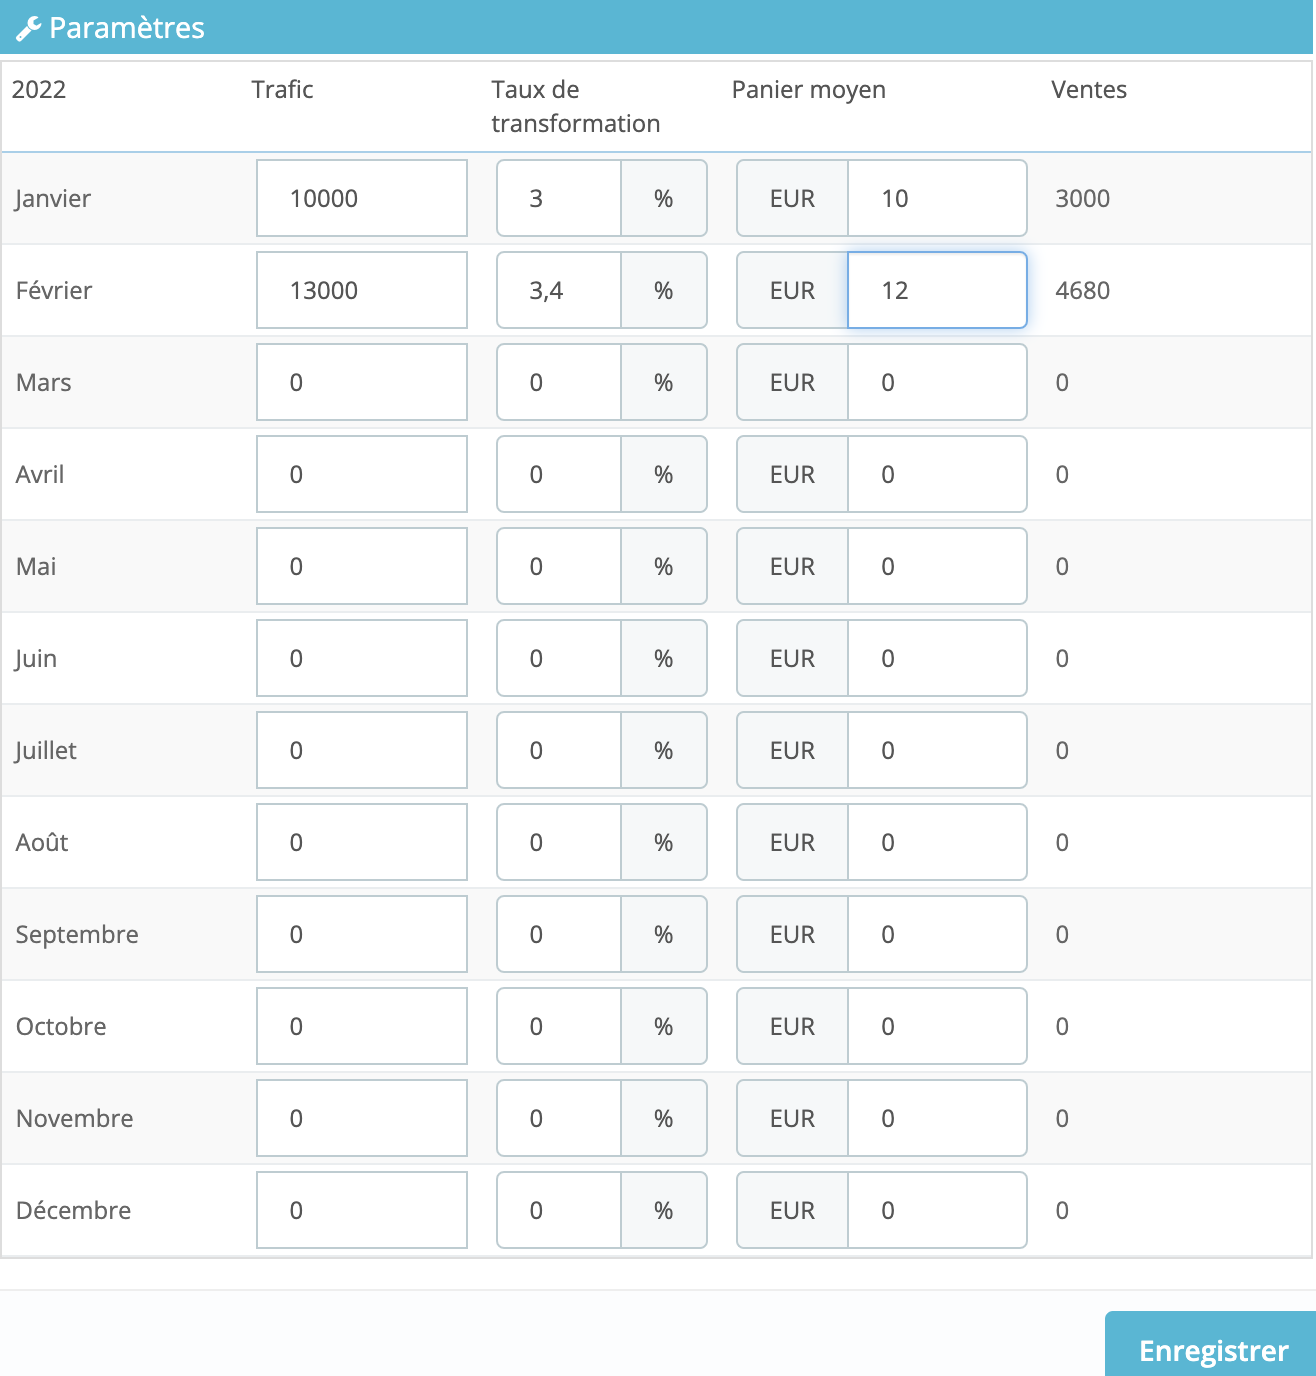
At the top right of the block, the block configuration form, the configuration icon represented by a cogwheel allows you to indicate your expectations month after month in terms of traffic, conversion rate and average basket value.
The "Sales" column on the right updates automatically according to the targets in the other columns, as shown in the example below:
How do I explore the "Products and Sales" block?
This block gives you at-a-glance access to your product rankings: best sellers, recent orders, most viewed products, and top searches.
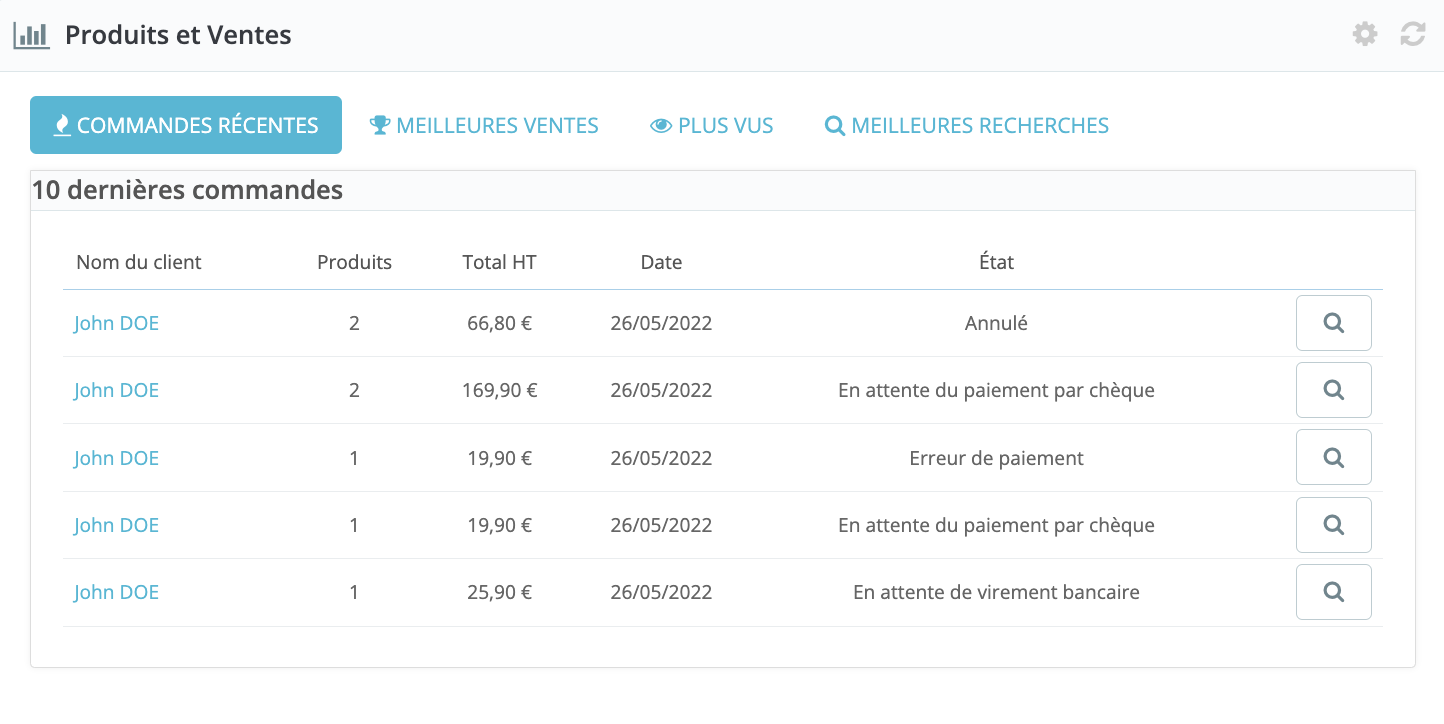
Using the configuration icon at the top right of the block, you can customize the number of elements to be displayed for each table.
How do I explore the "Activity overview" block?
The "Business overview" block gives you access to all your key figures at a glance.
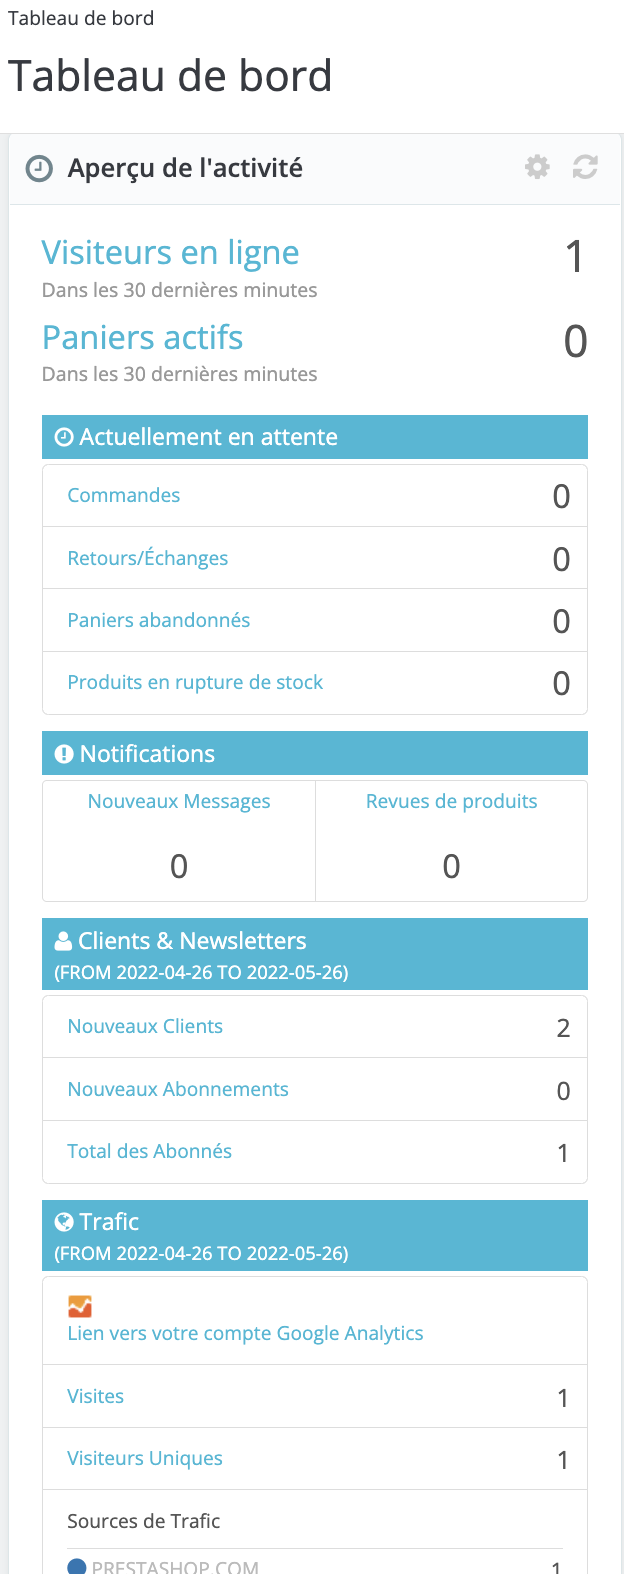
This module gives you access to :
- By the number of visitors in the last 30 minutes
- Number of active baskets in the last 30 minutes
- The number of backorders, return/exchange requests, abandoned baskets and sold-out products
- A link to your account Google Analytics
- Traffic statistics: visits, unique visitors and traffic sources
By clicking on the edit icon, you can set the following parameters:
- Active basket
- Online visitors
- Abandoned cart: to determine how long it takes for a cart to be considered abandoned without being validated.
Share